
生活是一幅大画布,应该让它充满色彩。 —— 丹尼·凯
有人会说,可视化就是用图形来表示数字。这句话说得没有错。不过总有时候,光用图形(点、线、面)是不够的,还需要用上颜色。颜色除了让单调、乏味的图案更加富有魅力以外,还可以让数据更加突出,让关系复杂但又相似的数据足够区分开来。另外,颜色还代表着我们的观点。
这篇文章将向大家描述我对颜色的一些了解,以及选择颜色时需要考虑的问题。
声明:本文是专题《数据可视化的最佳实践》的系列文章,内容摘自 Datawrapper Blog,著作版权由网站及其作者所有。I. 何时该用颜色?
When to use colors in data visualization?
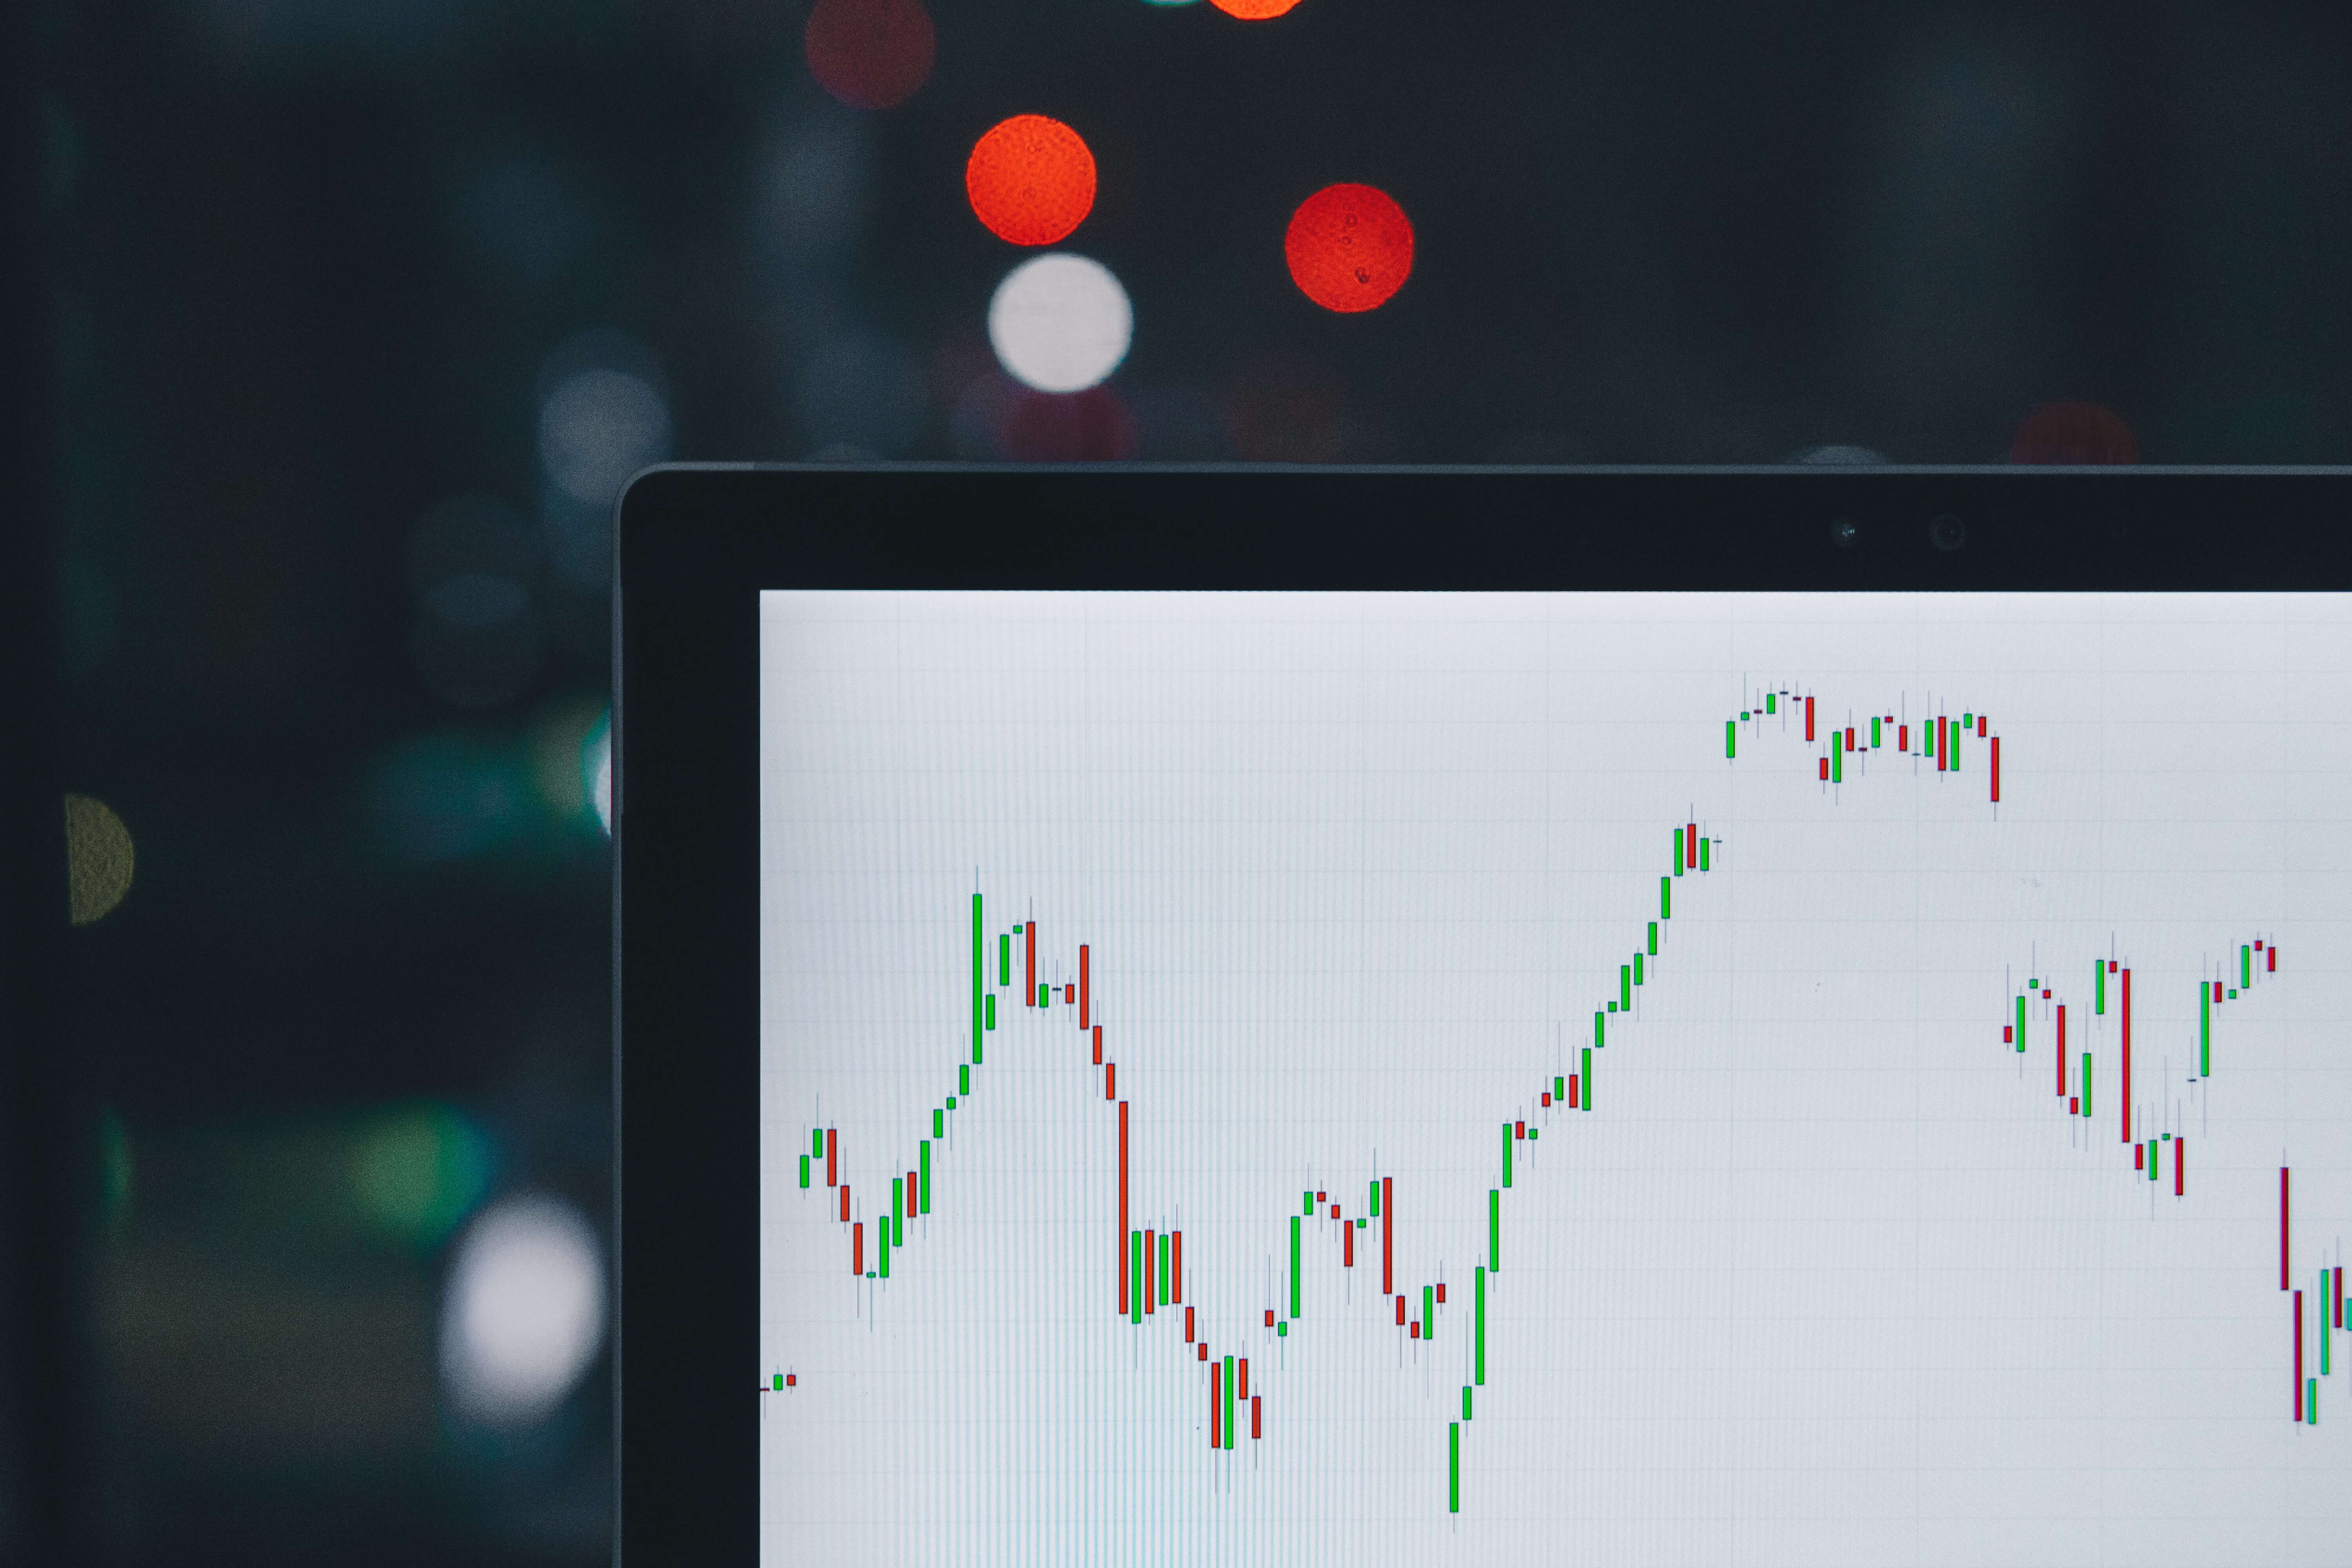
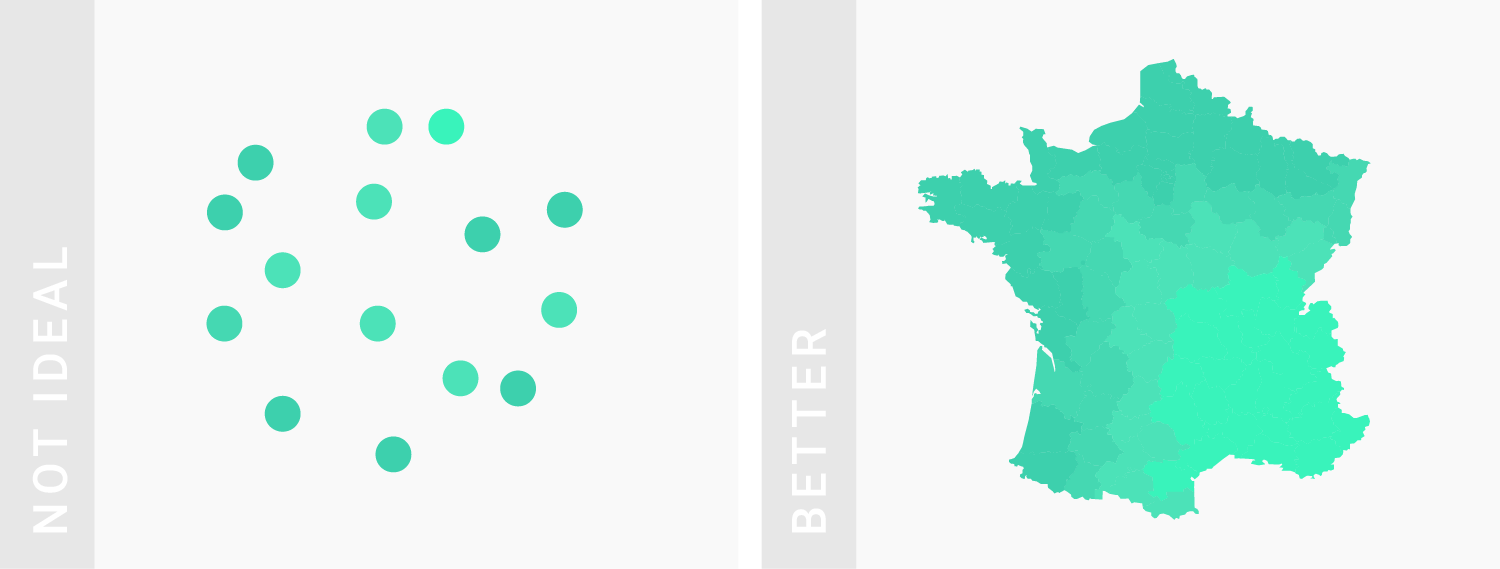
TIPS 1:使用柱状图、条形图、散点图或是面积图的时候
Consider showing your most important values with bars, position (like in a dot plot) or even areas, and to use colors to only show categories.
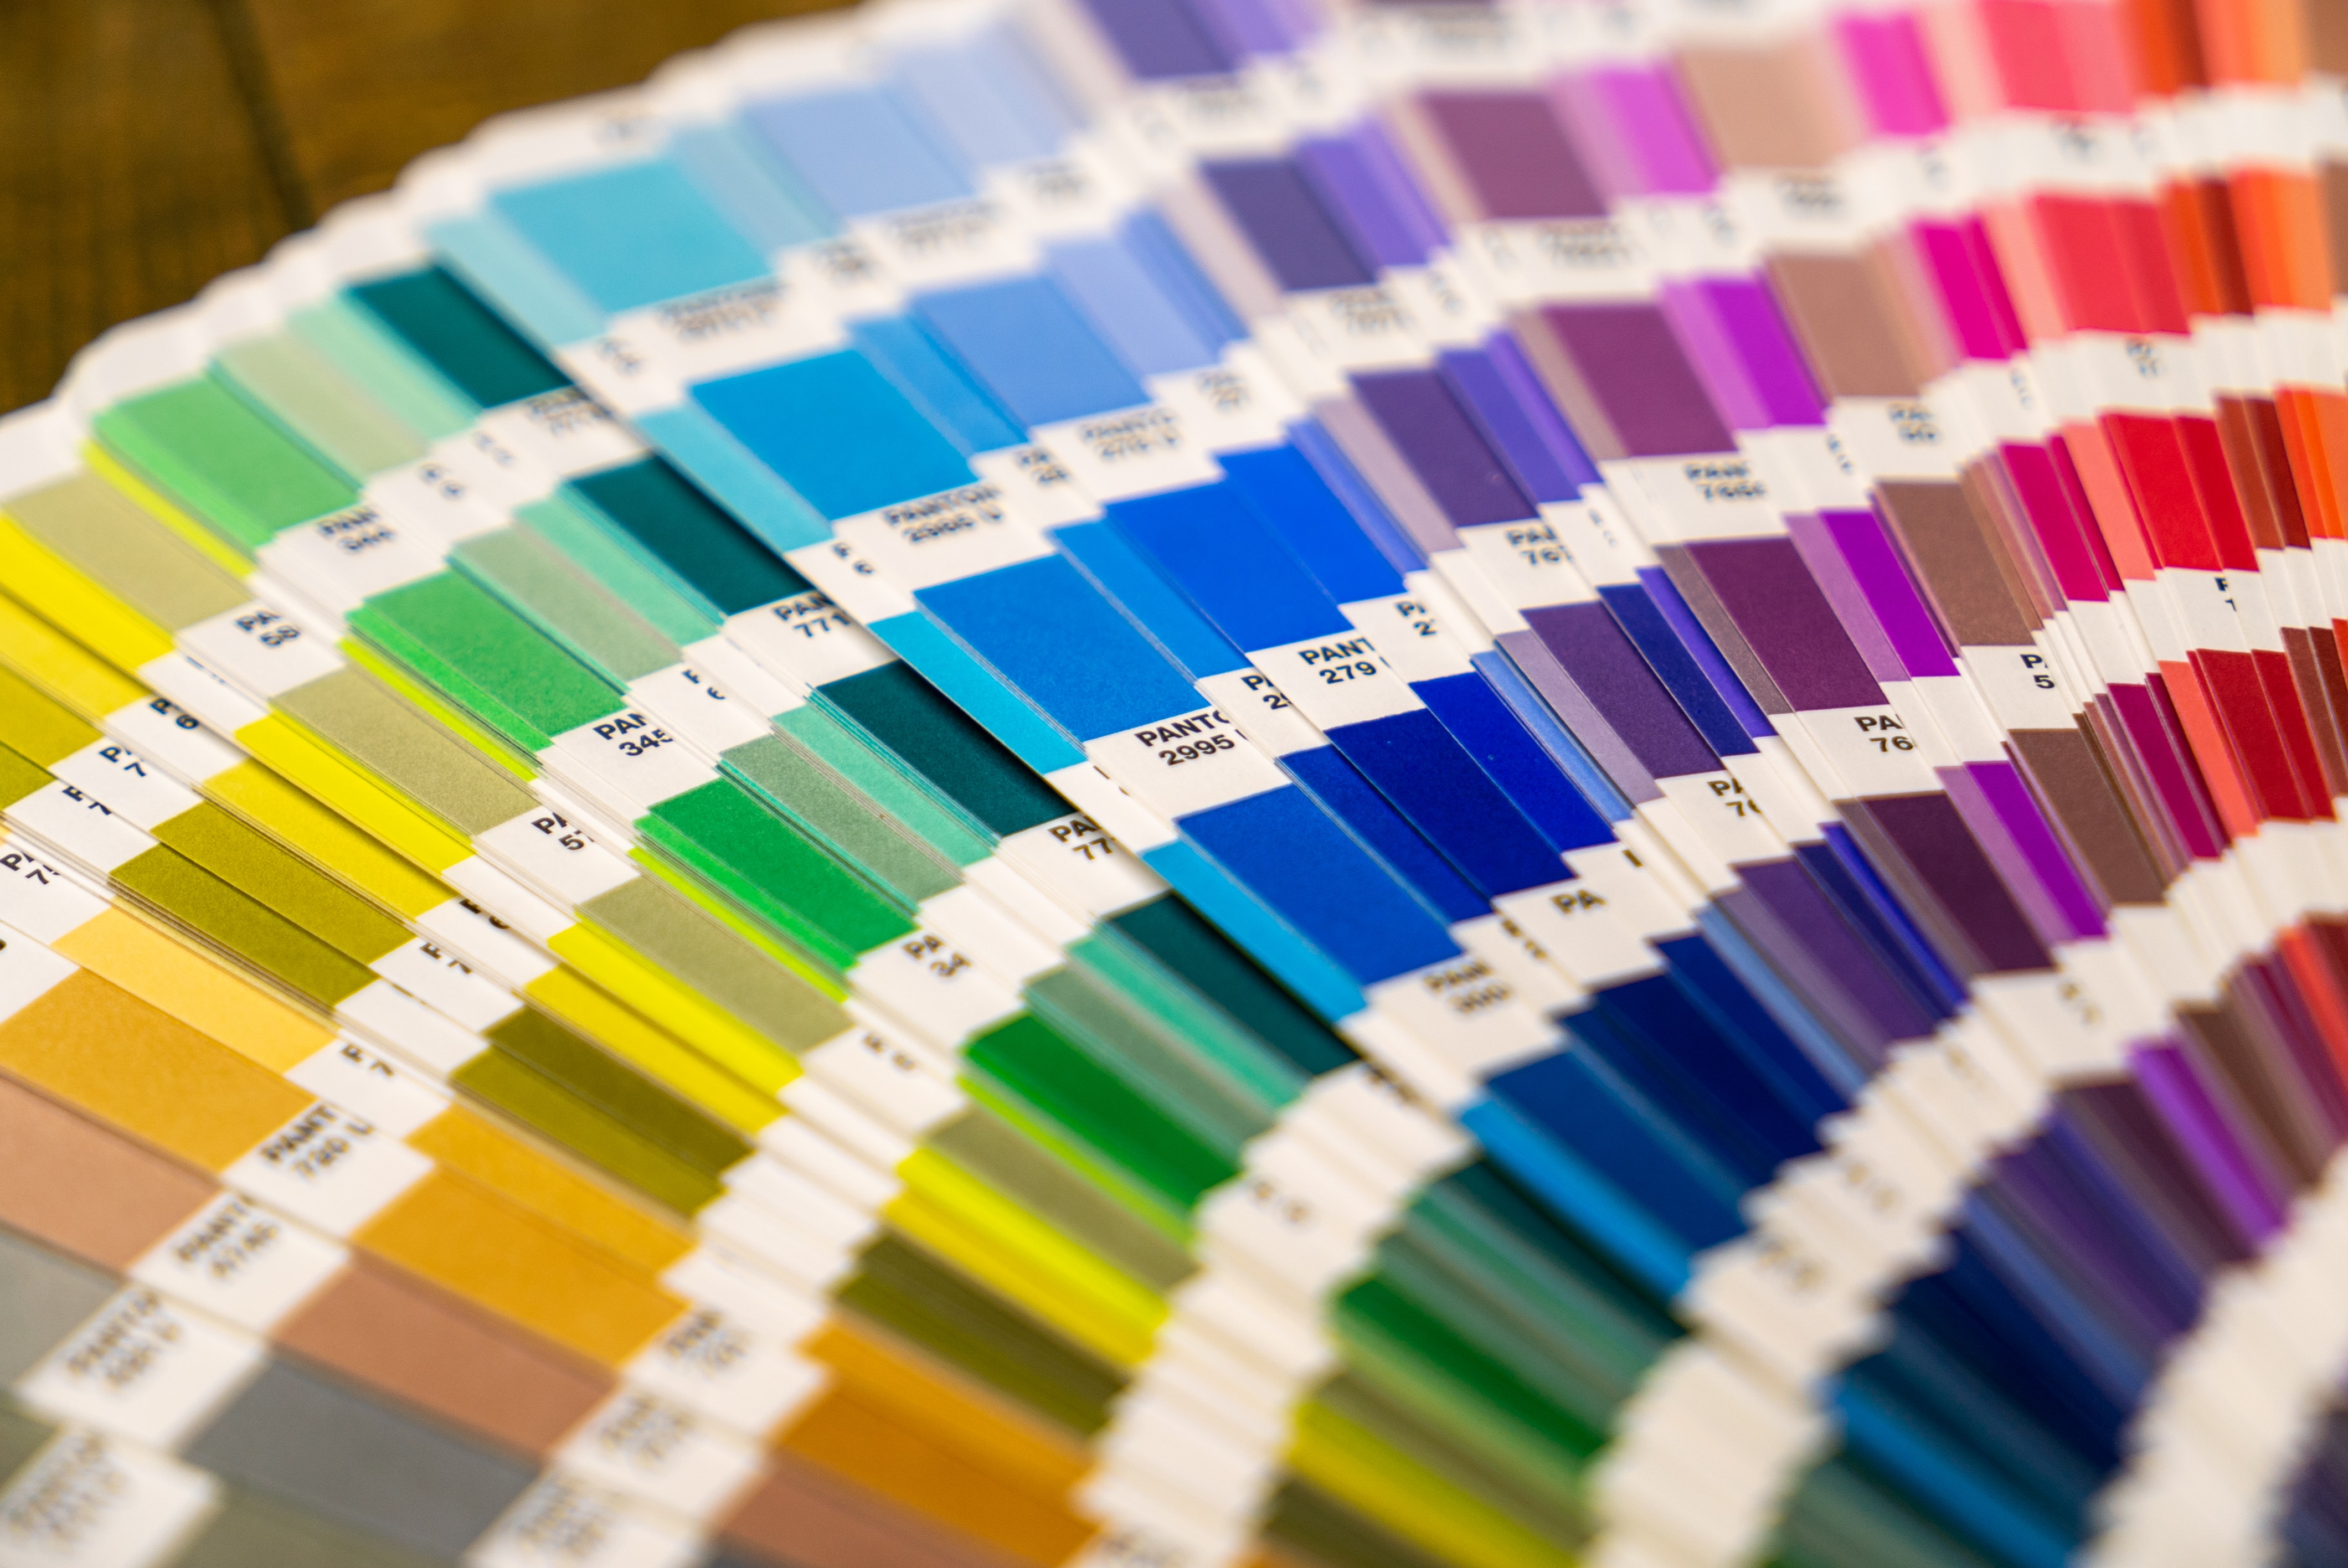
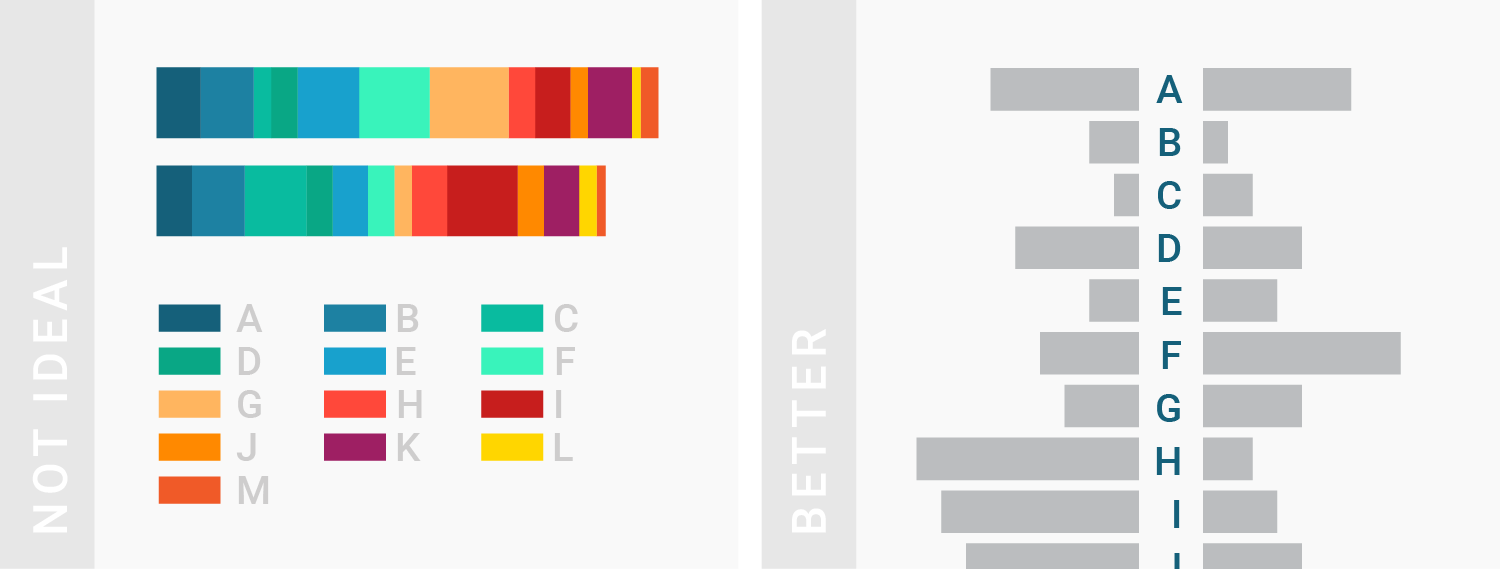
TIPS 2:最好不要超过7种颜色
If you need more than seven colors in a chart, consider using another chart type or to group categories together.
II. 怎样搭配颜色?
How to make better color choices?
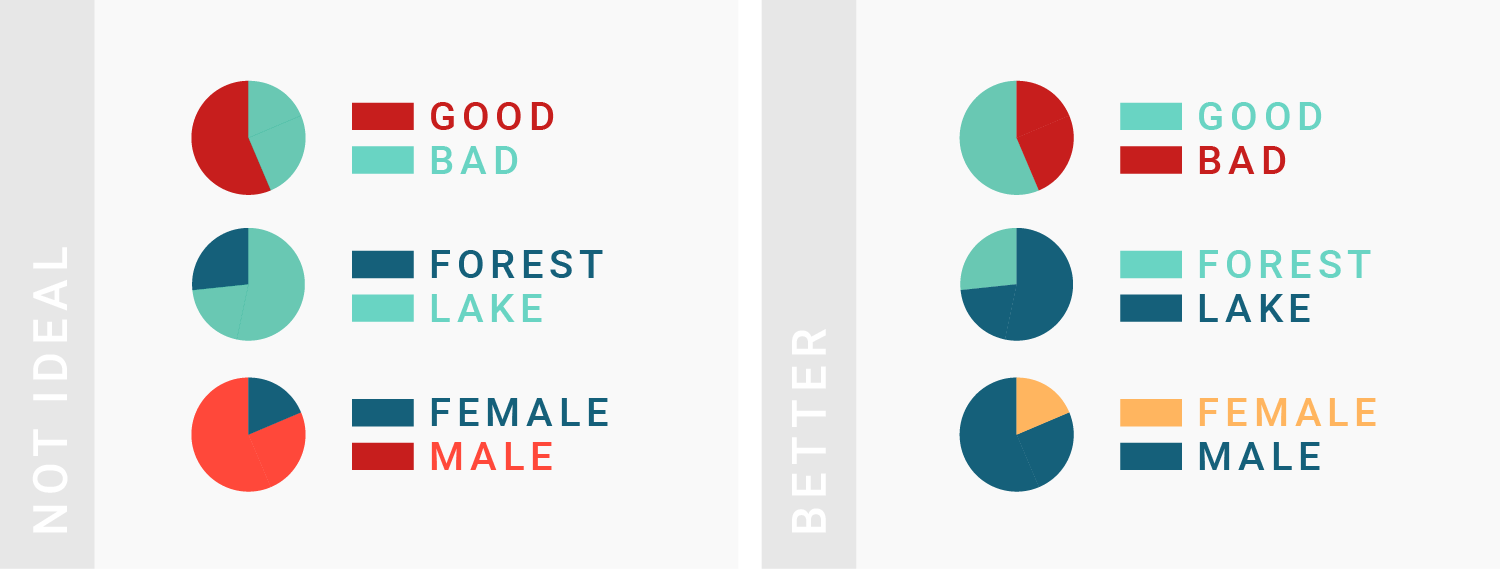
TIPS 1:变量和颜色要一一对应
Consider using the same color for the same variables.
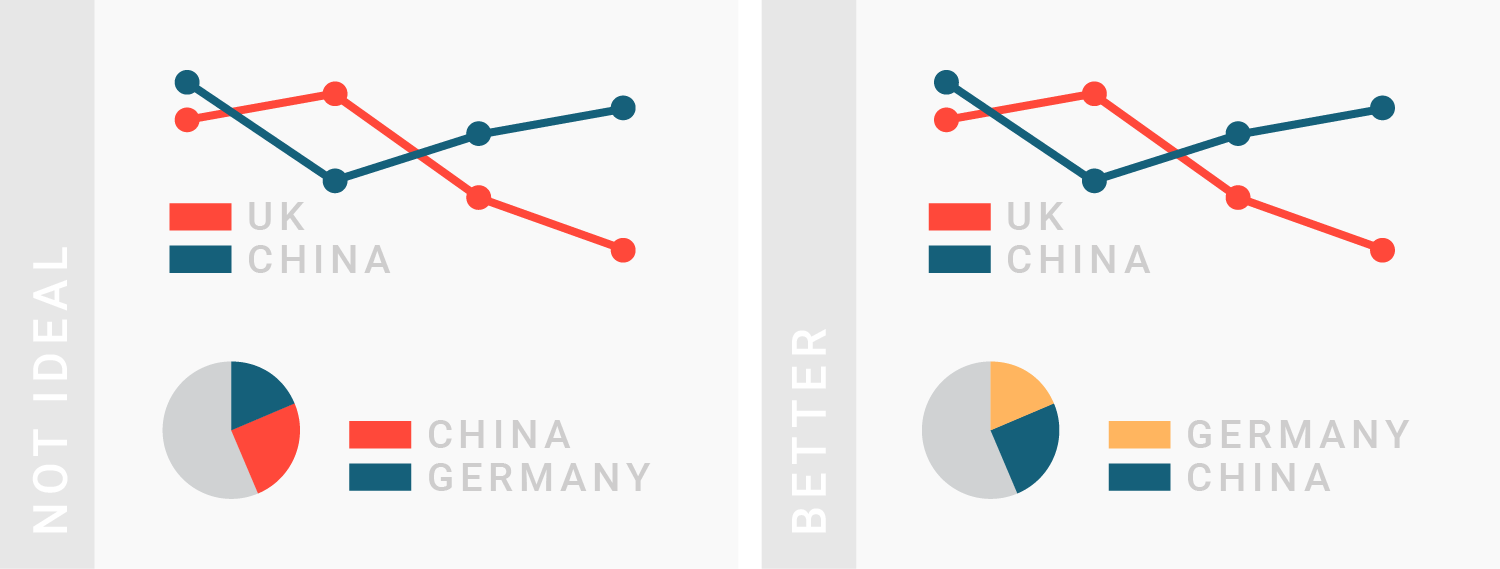
TIPS 2:介绍清楚颜色的编码(含义)
Make sure to explain to readers what your colors encode.
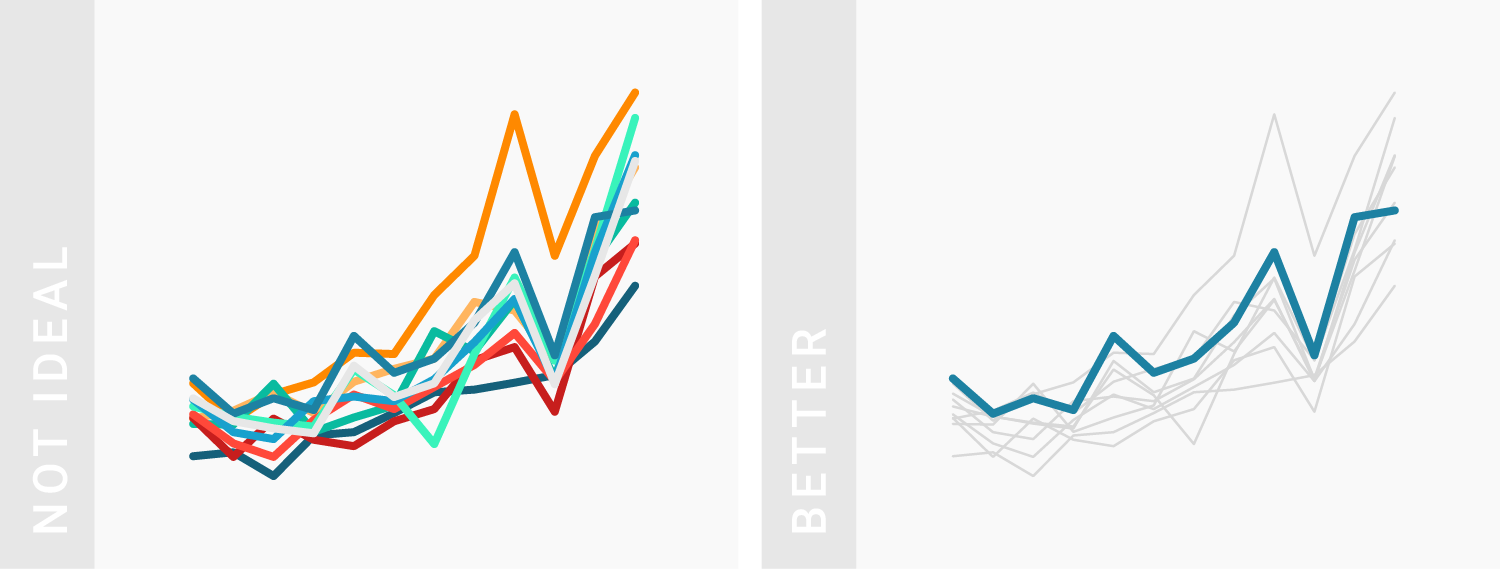
TIPS 3:借助灰色来衬托更重要的数据
Using gray for less important elements in your chart makes your highlight colors (which should be reserved for your most important data points) stick out even more.
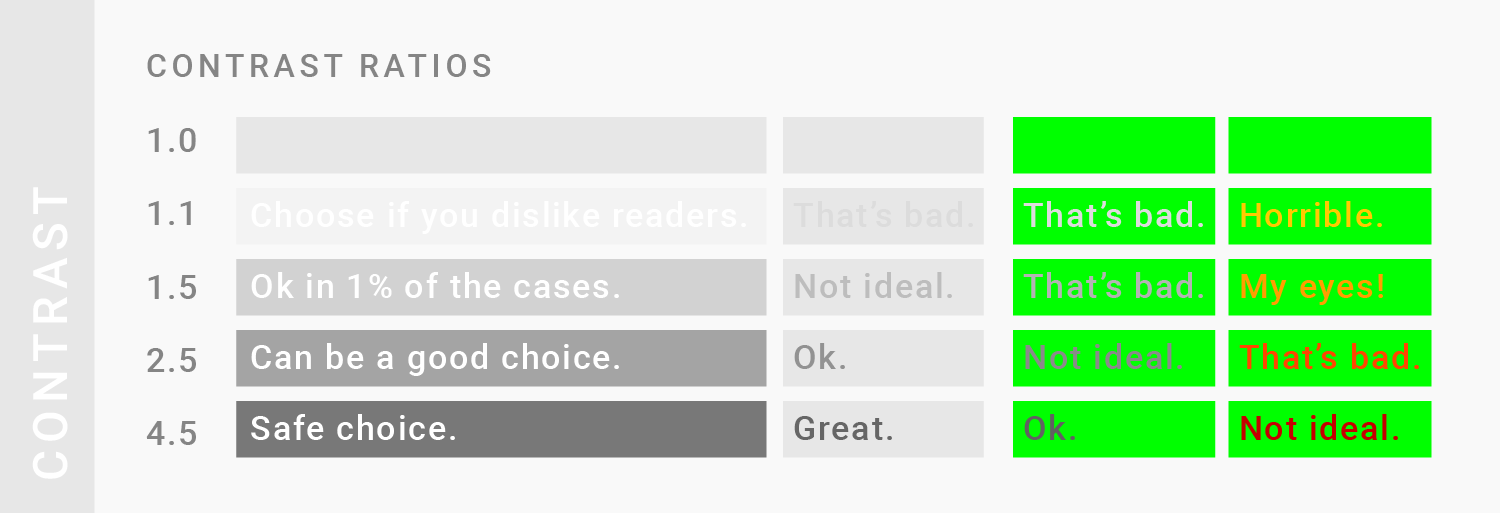
TIPS 4:确保颜色有足够的对比度,让人能够在低亮度甚至浅色背景下阅读
在光线不足,或者用了灰色等浅色调的情况,缺乏一定的对比度会让人不容易看清你的图表。这一点对于文字来说尤为重要——文字越小,只有对比度越高,才能让人看得更清楚。曾有人研究过,达到这样的效果,大文字的背景和前景的对比度至少要达到2.5,小文字的对比度至少要达到4。另外,除了要有较高的对比度外,还要避免背景颜色使用互补色(如红和绿、橙和蓝)和亮色。这个工具可以测试对比度、亮度的整体差异是否合规。
Make sure your contrasts are high enough. Caring about contrast means caring if your readers will be able to read your chart on their screen, even in low light and even if you use light colors like gray. Caring about contrast means caring if your readers will be able to read your chart on their screen, even in low light and even if you use light colors like gray. This is especially important for text: The smaller the text, the higher its contrast to the background needs to be for it to be readable. The contrast ratio between background and foreground should be at least 2.5 for big text and at least 4 for small text. In addition to having a high contrast ratio, avoid complementary hues (like red and green, orange and blue) and bright colors for backgrounds. Use this tool to test your color contrast, the brightness difference and if colors are “compliant”.
TIPS 5:增大绘图面积来应对低对比颜色(如浅色),尤其是没有其他颜色参杂的时候
Big areas can handle toned-down colors with little contrast, especially if there is no other (background) color between these areas.
TIPS 6:善用感官颜色
Use intuitive colors.
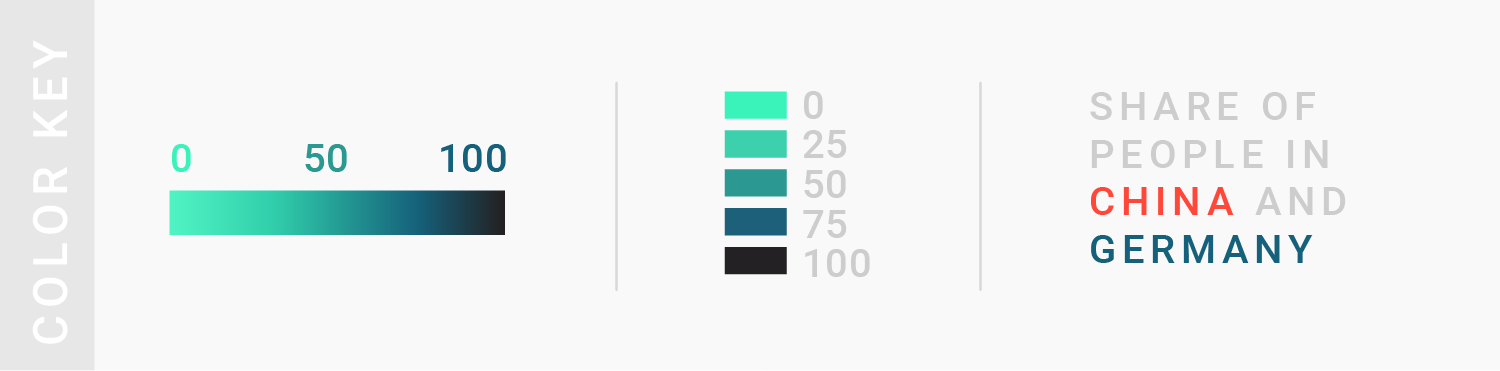
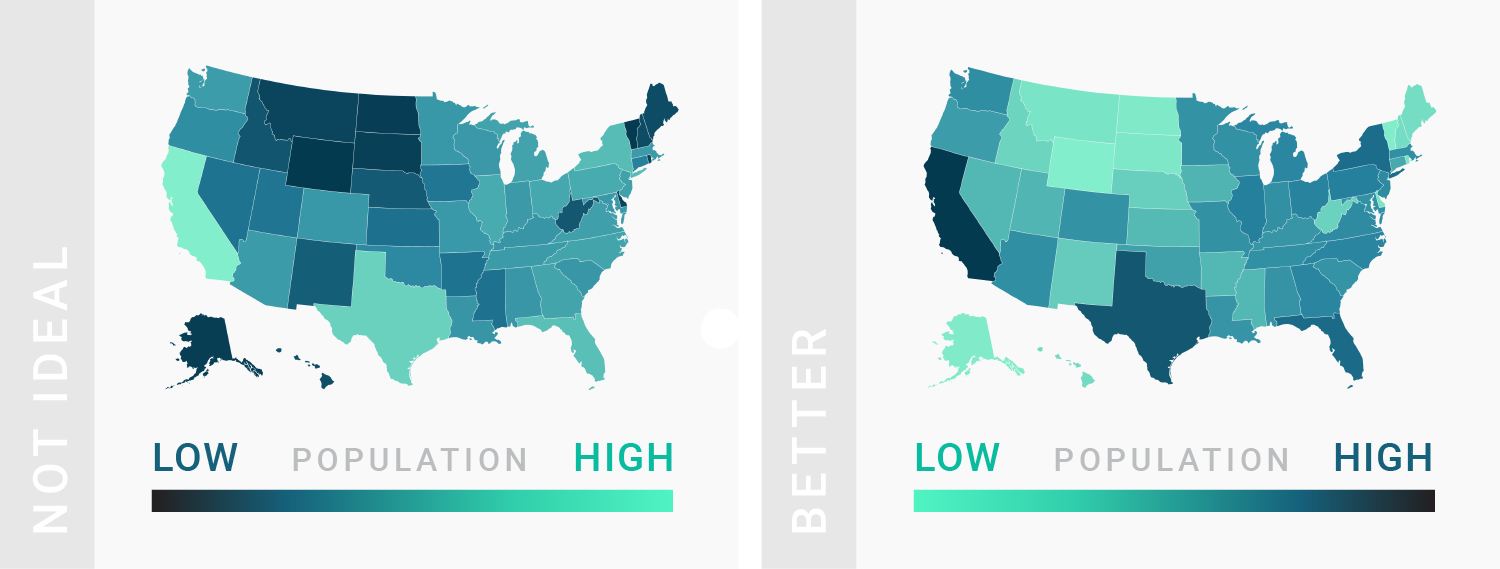
TIPS 7:浅色=数值小,深色=数值大
Use light colors for low values and dark colors for high values.
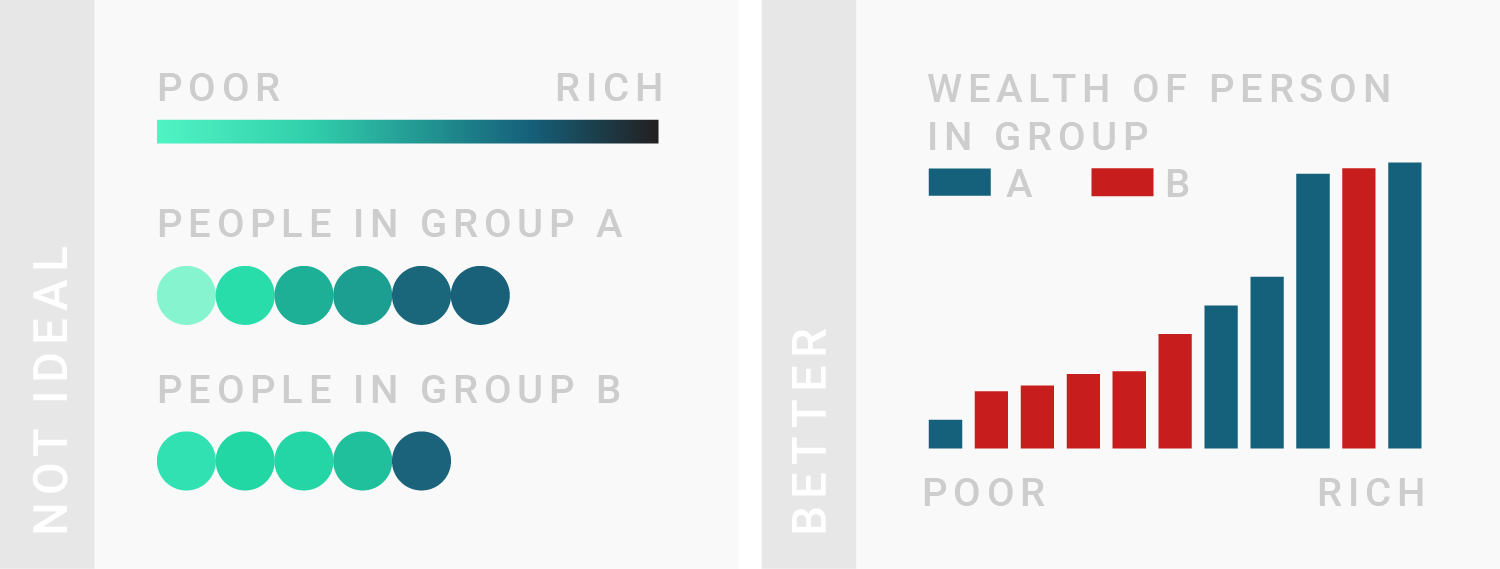
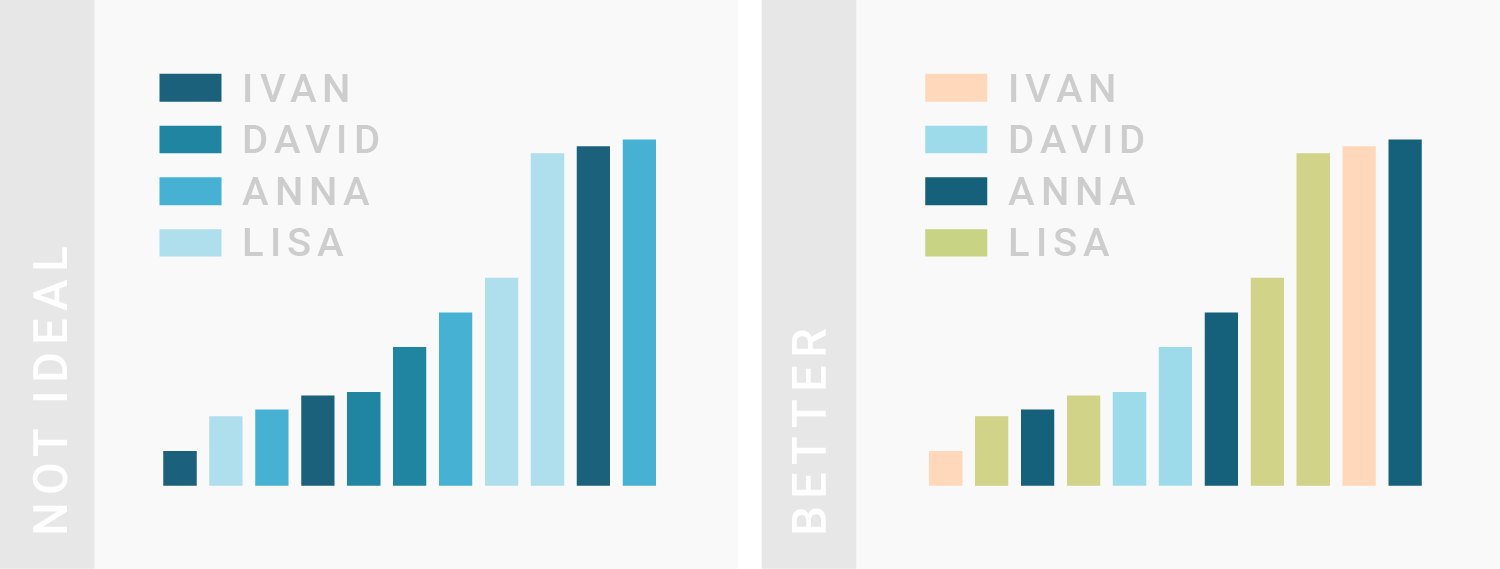
TIPS 8:渐变色不能用来表示类别
Don’t use a gradient color palette for categories and the other way round.
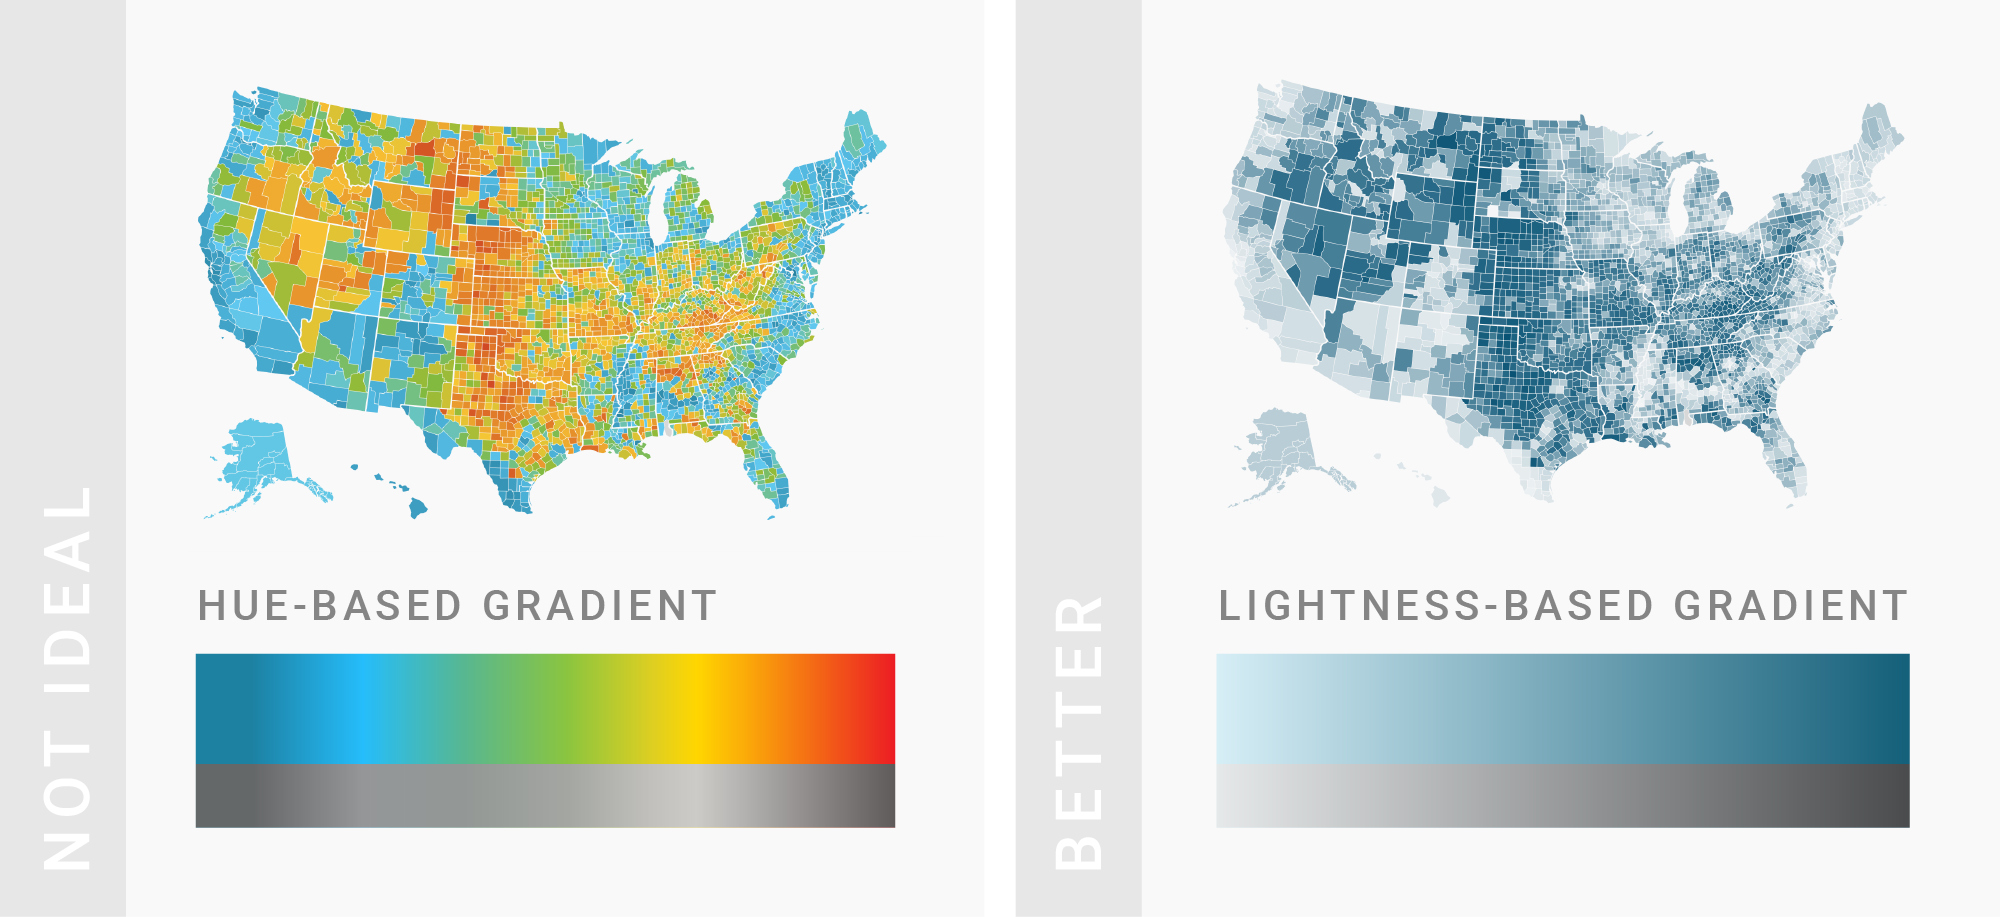
TIPS 9:亮度也可以作为渐变标准
Use lightness to build gradients, not just hue.
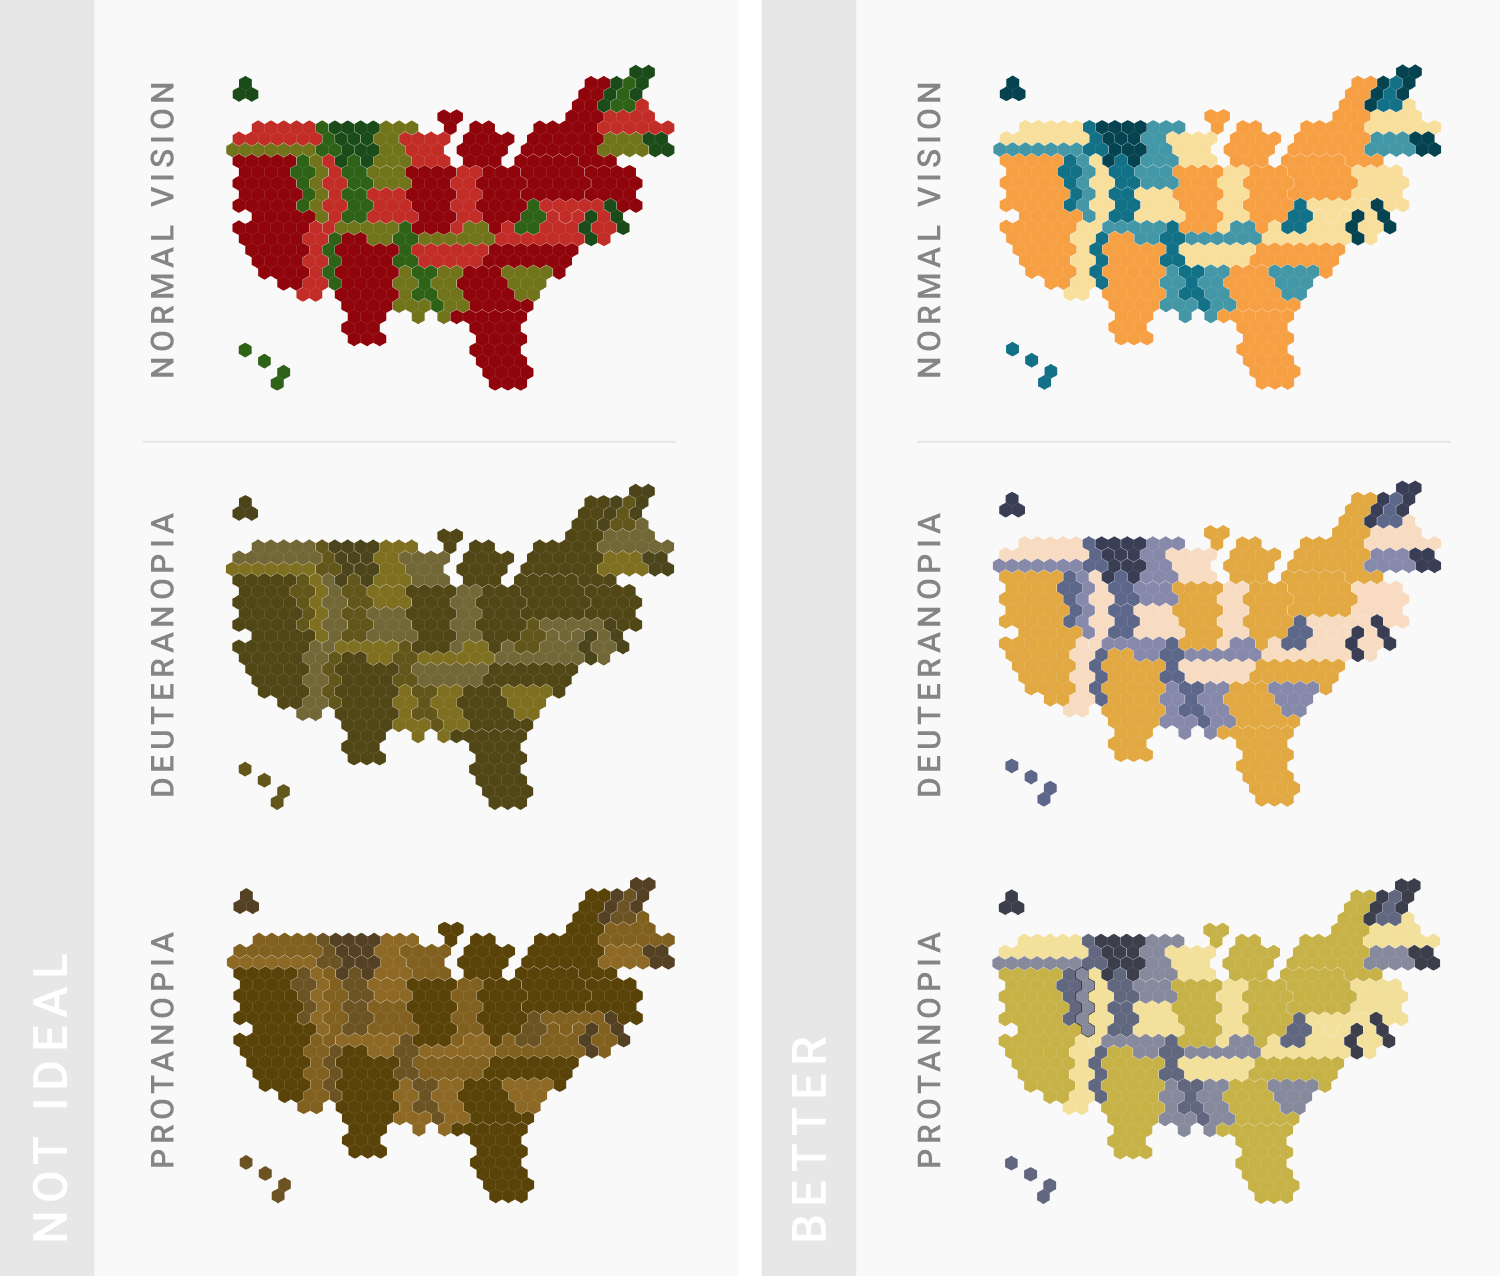
TIPS 10:为色盲人士着想
可以用这个工具检查你的色彩搭配。
Consider color-blind people. Use this online tool to make sure that color-blind users can distinguish the colors on your chart.